Q Step Research Internship
June – July 2021
The Q Step Research Internship aims to introduce more students to quantitative research methods.
I took part in the scheme in June-July 2021. It consisted of one week of training, which included lectures and workshops about R, QGIS and quantitative analysis in general.
After the first week, I began collaboration on the research project with another student. We performed data analysis aiming to uncover insights about the variations in outcomes of the covid-19 pandemic. This involved looking at case and death rates, compared with the underlaying geography of the population, which included sociodemographic and economic attributes sourced from the census data. We worked through each stage collaboratively, regularly reporting to our supervisors.
How the project went
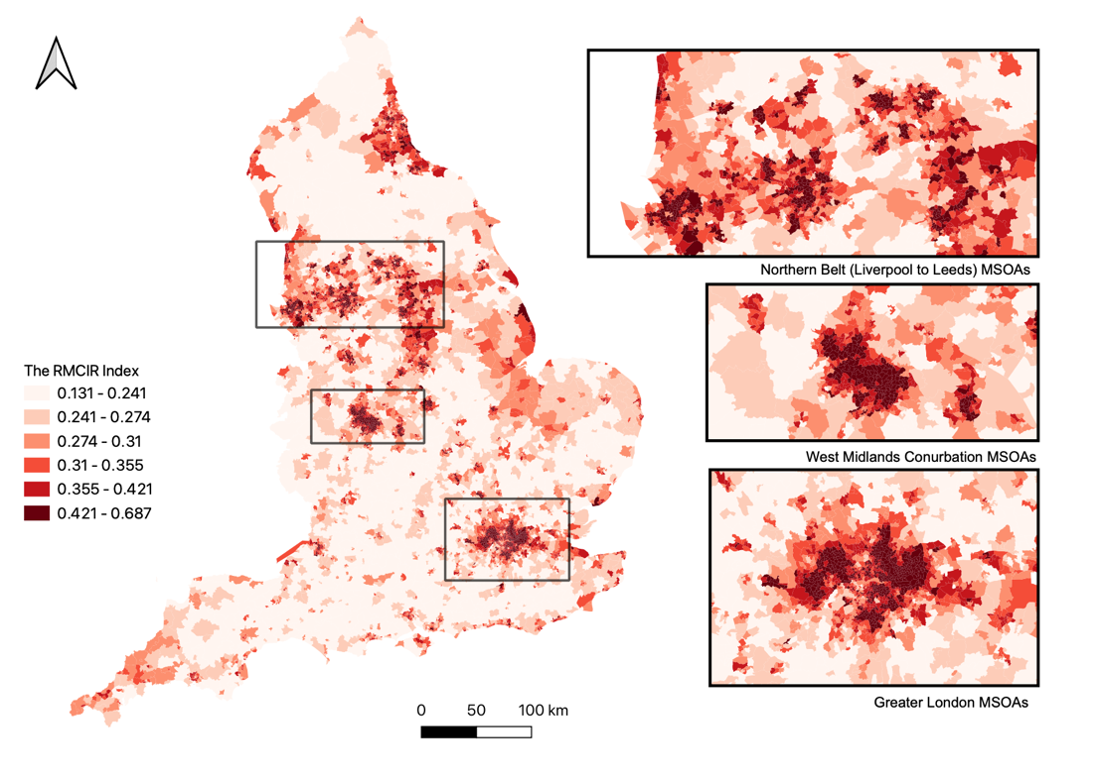
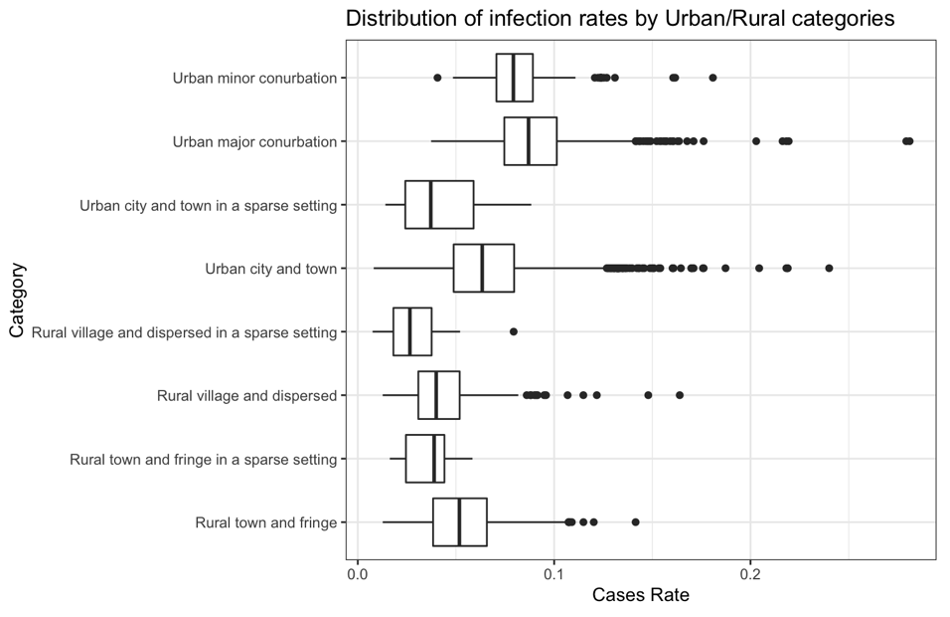
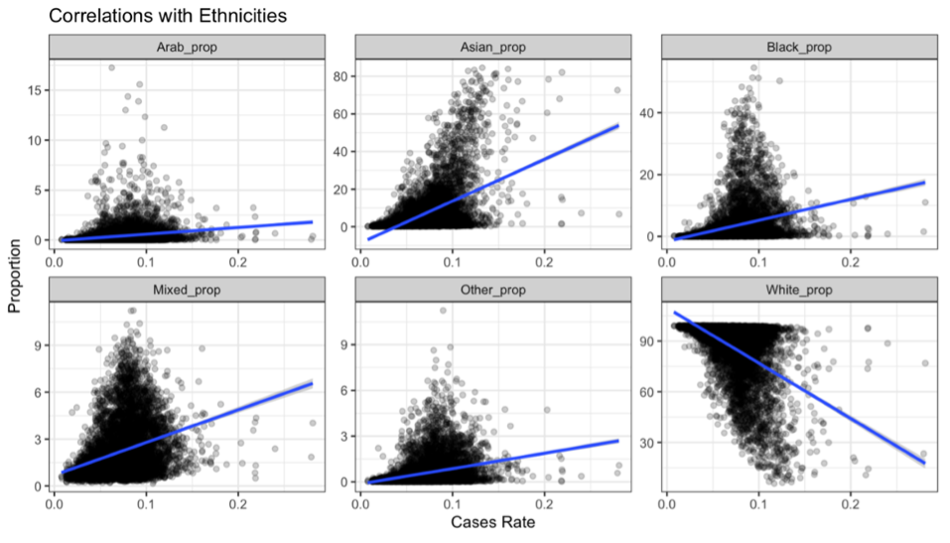
Firstly, the data on covid cases and deaths, as well population data were sourced from the UK government data portals. This involved reading through the metadata and making sure it is of good quality, for the analysis. The analysis part involved cleaning the data, running regression analysis between all the metrics and formulating insights based on the regression outcomes. Variables such as population density, ethnicity, deprivation index, unemployment, age and several others were used in the analysis. We also attempted to create our own composite indicator, aiming to best represent the case numbers by LSOA. Furthermore, we created maps of metrics used in the analysis, to assist the understanding and visual representation of the data. We also tried looking at spatial statistics like Moran’s I to check possible spatial autocorrelation in covid cases and deaths.
What i gained from it
The placement was a great opportunity for me to put my skills into practice. I had been practicing scripting and handling data in R and using GIS software before, but this was the first time I actually used these tools in a real-world project, outside of university practice or my own projects. It also required analytical thinking, which I enjoyed and want to continue improving on. Overall, the project was a great opportunity both for developing technical skills, as well as teamwork and communicating analysis to the supervisors.
What we found
Thanks to the analysis, we discovered several variables are highly correlated with covid outcomes. The most correlated with case rates were deprivation, non-white population rates, overcrowding and low car ownership rates. Covid cases showed some autocorrelation patterns, especially in densely populated areas, while death rates did not.